
Airbnb, Booking and Expedia: Who Captures the Value of Travel?
How travel platforms turn demand into revenue – and what their economics mean for hospitality operators, property owners and investors.
A traveler books three nights in Bordeaux. The accommodation provider supplies the property, prepares the room and delivers the stay. Somewhere between the traveler’s search and their arrival, a platform earns revenue for making that transaction happen.
That arrangement can work well for both sides. A small operator gains access to customers it could struggle to reach independently. The traveler gets choice, reviews, payment infrastructure and a familiar booking process.
The tension appears when the operator needs more revenue but must spend progressively more to secure it.
Airbnb, Booking Holdings and Expedia Group offer three useful perspectives on this relationship. Each connects travel demand with supply. Each has built a different way of earning from that connection.
Our view is that the most useful question for a hospitality business is how much incremental contribution each distribution channel produces, and how reliably that contribution converts into cash. For investors in the platforms, the corresponding question is how much the business must keep spending to secure the next booking.
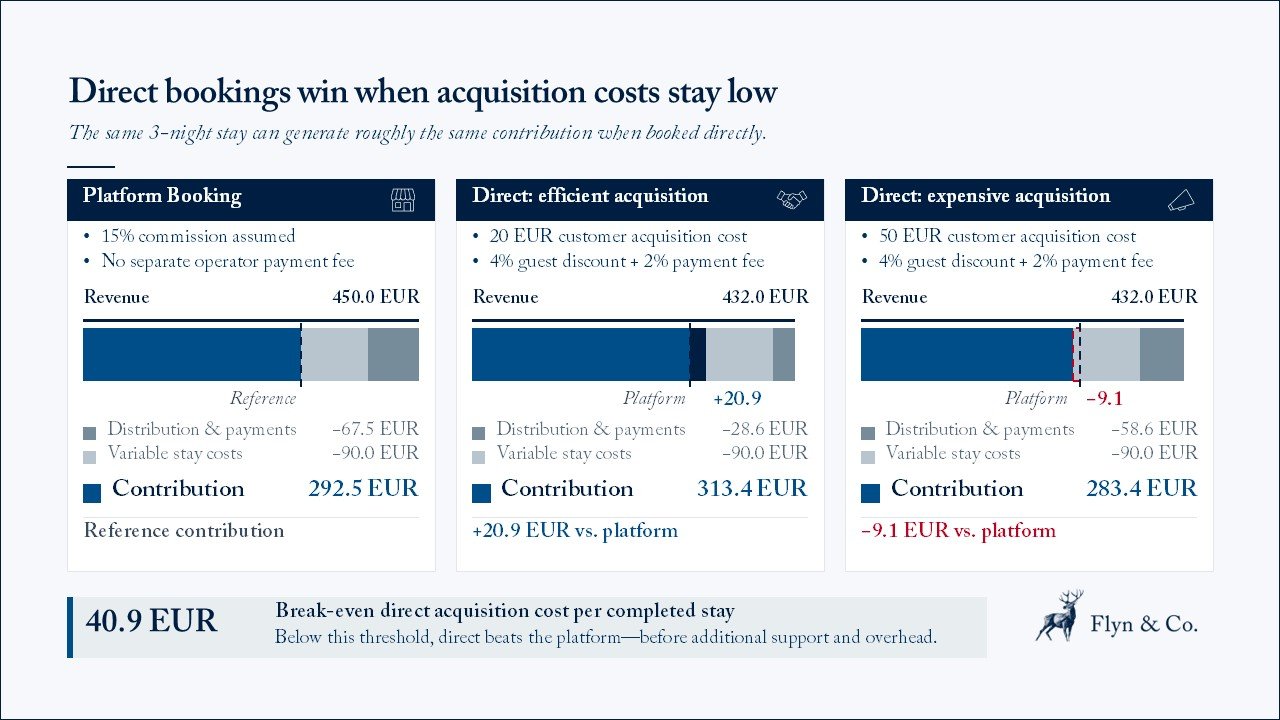
Direct bookings earn a higher contribution when acquisition costs stay below €40.86 per completed stay.
Three businesses competing for the same traveler
The brands appear beside one another in a traveler’s search. Their underlying businesses deserve separate treatment.
| Group | Business model in brief | Strategic question |
|---|---|---|
| Airbnb | A marketplace connecting guests with hosts, earning service-fee revenue from bookings | Can distinctive supply and customer preference support repeat demand? |
| Booking Holdings | A portfolio of travel brands using agency, merchant and advertising models | Can scale, conversion and payment services increase the value captured from each customer? |
| Expedia Group | Consumer travel brands alongside a B2B business distributing travel inventory and technology through partners | Can the group earn from more journeys, including those beginning outside its own consumer brands? |
Business descriptions draw on the companies’ 2025 annual reports. The strategic questions are Flyn & Co. analysis. [1] [2] [3]
Airbnb’s proposition begins with the accommodation itself. Its marketplace connects travelers with stays, alongside experiences and services. Services and redesigned experiences launched in May 2025, widening the activities available through the platform. [1]
The commercial attraction is understandable: give a traveler more reasons to return, and potentially earn from more of their trip. The financial test is harder. Each additional category needs enough demand, dependable supply and operational support to justify its investment.
Booking Holdings combines distribution with transaction infrastructure. Booking.com belongs to the group, but the listed company’s results cover a broader business. Its revenue includes agency commissions, merchant revenue and advertising and other activities. In an agency arrangement, the platform generally earns for facilitating a reservation; in a merchant arrangement, it also facilitates the payment transaction. [2]
Processing payment can deepen the platform’s role in the booking. It also introduces transaction costs and operational responsibilities. Additional revenue from payment services therefore needs to be assessed alongside the costs required to deliver it.
Expedia Group operates through both consumer brands and partner distribution. Its B2B business provides travel supply and technology to businesses including airlines, travel agencies and financial institutions. A traveler can consequently use Expedia’s infrastructure without beginning their journey on an Expedia-branded website. [3]
That creates a different strategic option: participate in another business’s customer relationship. The relevant economic question becomes the contribution retained after partner remuneration and servicing costs.
Booking value is not platform revenue
The scale of these businesses is easier to understand when the value of travel booked is separated from the revenue recognised by the platform.
The table uses full-year 2025 as a common annual comparison.
| FY2025 metric | Airbnb | Booking Holdings | Expedia Group |
|---|---|---|---|
| Gross booking value / gross bookings | 91.3 B USD | 186.1 B USD | 119.6 B USD |
| Revenue | 12.2 B USD | 26.9 B USD | 14.7 B USD |
| Revenue ÷ gross booking value | 13.4% | 14.5% | 12.3% |
Ratios calculated using unrounded reported figures. These are group-level revenue-to-bookings ratios, not supplier commission rates. Sources: company FY2025 disclosures. [1] [2] [3]
A hotel owner should not interpret Booking Holdings’ 14.5% ratio as the commission their property ought to pay. Nor does Expedia’s lower ratio establish that its distribution is cheaper.
Product mix matters. Flights, accommodation, advertising and payment services generate different revenue relative to booking value. Booking Holdings explicitly identifies the growing share of flight bookings as a factor reducing its aggregate revenue-to-bookings ratio, partly offsetting other effects. [2]
Timing matters too. A reservation can enter a booking metric before the associated revenue is recognised. Airbnb, for example, records booking value when reservations are made, while revenue recognition generally occurs at check-in. [1]
For an investor, the useful analysis separates volume, pricing, product mix and monetisation. For an accommodation provider, the useful comparison starts with the actual contract and reservation-level settlement.
Confusing those two perspectives produces misleading benchmarks.
The recurring cost of winning demand
A marketplace can be large and still need to spend heavily to attract its next customer.
Booking Holdings reported marketing expenses of approximately 8.2 B USD in 2025, equivalent to 30.4% of revenue. That illustrates how commercially significant customer acquisition remains even at considerable scale. [2]
The strategic value of repeat customers follows directly. When a traveler returns through an app, a saved account or a familiar website, the platform may have less need to buy another paid referral. Loyalty benefits and brand investment still cost money, but the acquisition economics can change.
This also clarifies a frequent ambiguity in travel discussions:
- For a platform, a direct booking means the customer comes directly to that platform.
- For a hotel, a direct booking means the customer books with the hotel itself.
The same reservation can be direct for Booking.com and intermediated for the hotel.
Recent disclosures show continued booking growth. Booking Holdings reported Q3 2026 gross bookings up 10% year on year; Expedia reported 11% growth for the same quarter. Airbnb’s Q2 2026 gross booking value increased 16%. The Airbnb figure covers a different period and should not be used as a like-for-like quarterly ranking. [4] [5] [6]
For management teams, however, growth is only the starting point.
An additional reservation is attractive when its expected revenue exceeds the acquisition, payment, servicing and incentive costs required to secure it. That assessment becomes more demanding when growth depends on discounts or customer rewards.
We would examine repeat behavior and contribution by acquisition cohort before treating booking growth as evidence of stronger economics. A customer who returns profitably is worth more than one repeatedly reacquired at an increasing cost.
For operators, the decision belongs at contribution level
Consider an independent accommodation business evaluating whether to invest more in direct bookings.
The temptation is to compare a platform commission with the cost of a booking engine. That leaves out customer acquisition, discounts, payment processing and the work involved in handling the reservation.
The following example compares three ways of selling the same three-night stay.
Illustrative assumptions: all amounts exclude VAT and tourist taxes; the stay is completed; variable stay costs are identical. The 15% platform commission is an assumption, not a quoted fee for any named platform. The example assumes no separate operator payment charge for the platform reservation.
| Per completed three-night stay | Platform booking | Direct: efficient acquisition | Direct: expensive acquisition |
|---|---|---|---|
| Accommodation revenue after discounts | 450 EUR | 432 EUR | 432 EUR |
| Platform commission | (67.50 EUR) | – | – |
| Direct customer acquisition cost | – | (20 EUR) | (50 EUR) |
| Payment processing | Included in assumption | (8.64 EUR) | (8.64 EUR) |
| Variable stay costs | (90 EUR) | (90 EUR) | (90 EUR) |
| Contribution before fixed costs | 292.50 EUR | 313.36 EUR | 283.36 EUR |
The direct guest receives a 4% discount. Payment processing costs 2% of the discounted amount.
With acquisition costing 20 EUR, the direct reservation contributes 20.86 EUR more. At an acquisition cost of 50 EUR, it contributes 9.14 EUR less.
The break-even direct acquisition cost is:
432 – 8.64 – 90 – 292.50 = 40.86 EUR per completed stay.
That is a usable management threshold. A general ambition to “increase direct bookings” provides much less guidance.
The threshold must still absorb any additional reservation support, refunds, chargebacks and technology costs. A standalone direct-booking investment also needs to recover its fixed setup and maintenance expenditure.
There is another issue: whether the bookings are genuinely interchangeable.
A platform reservation that fills an otherwise empty Tuesday creates contribution that might never have existed through the direct channel. Removing that distribution to save commission can reduce profit.
Conversely, a discounted platform booking during a sold-out weekend may displace a more profitable reservation. Its commission is only part of the economic cost.
This is why channel decisions should be made by season, booking window and customer segment. Annual averages conceal the difference between acquiring demand and paying unnecessarily for demand the business could already attract.
For a hotel, one useful measure is room contribution per available room: room revenue after distribution and variable room costs, divided by available room nights. It connects occupancy, pricing and the cost of securing the business. For holiday rentals, apply the same logic per available unit-night.
Is booking growth improving your hospitality margins?
Flyn & Co. builds financial models connecting occupancy, pricing, distribution costs, operating expenses and investment returns. Assess which channels create contribution and how changes in your booking mix affect cash flow.
Regulation creates room to act; execution determines the benefit
European accommodation providers have greater freedom to differentiate their offers across channels.
Booking.com has been subject to the relevant Digital Markets Act obligations since 14 November 2024. These prohibit parity requirements that prevent providers from offering better prices or conditions elsewhere, including through their own websites. [7]
The European Commission’s September 2026 update also describes further changes to Booking.com’s programmes and transparency, including removing external prices from potential eligibility assessments for Booking Sponsored Benefit. The update concerns properties in the European Economic Area. [8]
The commercial opportunity deserves careful testing. An operator may offer a direct price advantage, a more suitable cancellation policy or an additional service. Each option has a cost, and the value perceived by the traveler may differ from that cost.
A price discount is particularly easy to implement and particularly easy to overuse. The worked example shows how quickly it consumes the commission saving.
AI introduces a separate uncertainty: where the traveler begins their search.
Booking Holdings’ Q3 2026 release describes investment in AI experiences and collaboration with AI platforms. [4]
Our interpretation is that AI could change who controls the initial customer interaction without necessarily removing the need for travel distribution infrastructure. Finding a suitable property is one task; confirming live availability, processing payment, handling cancellation and resolving a failed stay are others.
An AI assistant could become another source of customer acquisition for established platforms. It could also strengthen a new intermediary’s negotiating position.
For planning purposes, both outcomes deserve a scenario. Assuming that AI automatically eliminates intermediaries is premature; assuming that acquisition economics will remain unchanged is equally weak.
Cash timing changes the investment case
Travel platforms and accommodation businesses can have very different cash cycles, even when they participate in the same reservation.
Expedia’s 2025 annual report identifies approximately 9.3 B USD of advance customer cash payments within deferred merchant bookings at year-end. It also reports that working-capital movements, including growth in deferred merchant bookings, supported operating cash flow during the year. [3]
These balances carry future obligations. Their contribution to cash generation depends partly on the relationship between new bookings, completed travel, cancellations and supplier settlement.
For a platform investor, that means cash-flow analysis should distinguish operating profitability from movements in customer prepayments and other working-capital balances. A favorable booking cycle should not automatically be extrapolated into permanent cash generation.
For a property owner, the questions are more immediate. When does the channel pay? Which expenses fall due before arrival? What happens to liquidity if cancellations increase just before peak season?
A useful hospitality model follows the reservation through to the bank account. It should connect booking pace and cancellation assumptions to realised occupancy, net revenue, operating costs, payment dates and CAPEX.
As in a practical driver-based budget, those assumptions should lead to explicit decisions: when to adjust prices, release inventory, increase marketing or preserve cash.
Platform concentration also belongs in the downside case. A business generating attractive profit through one dominant channel should quantify the effect of reduced visibility, higher distribution costs or slower replacement demand. The financial exposure becomes clearer when expressed as lost contribution and the cash required to rebuild bookings.
Airbnb, Booking and Expedia make travel distribution accessible at enormous scale. For many operators, that access is economically valuable.
The management discipline is to establish what each channel earns its place by doing. Some bring otherwise unreachable guests. Others fill weak periods, support international demand or simplify transactions.
The strongest distribution strategy assigns each channel a measurable role – and retains enough contribution and cash to make the underlying hospitality investment worthwhile.
For property owners, Flyn’s real estate advisory approach shows how operating assumptions fit into a property investment case. For a worked example in another seasonal business, see how Bordeaux wine estates can model cash over 24 months.
More posts...
FP&A and Cash Forecasting: How Much Can Your Business Afford to Commit?
A business can finish the quarter with enough cash and still face a liquidity constraint along the way. Learn how FP&A connects cash forecasts, growth commitments and the deadline for management action.
Preparing a Board for a Difficult Quarter
How to explain a performance miss and secure decisions while the business still has room to act.
SaaS Financial Planning: How to Turn ARR Growth Into Cash and Enterprise Value
SaaS Financial Planning: How to Turn ARR Growth Into Cash and Enterprise Value ARR growth tells you whether a SaaS company is getting bigger. It
Budget 2027: Build a Plan Your Business Can Actually Use
The strongest budgets make assumptions explicit, quantify the cash impact and define how management will respond.
Why Bordeaux Wine Estates Need a 24-Month Cash Model
Why Bordeaux Wine Estates Need a 24-Month Cash Model Bordeaux’s wine industry is adjusting to lower volumes, shifting consumption, weaker exports and structural vineyard contraction.
Fractional CFO vs. Full-time CFO: Which One Should an SME Choose?
Fractional CFO or full-time CFO? Learn which option makes more sense for SMEs, growing businesses, and founder-led companies that need financial leadership without overbuilding the finance function.