
SaaS Financial Planning: How to Turn ARR Growth Into Cash and Enterprise Value
ARR growth tells you whether a SaaS company is getting bigger. It does not necessarily tell you whether the business is getting better.
Two SaaS companies can both grow ARR by 25%. One may have strong retention, attractive gross margins, efficient customer acquisition and a credible path to free cash flow. The other may be replacing churned customers with expensive new sales, discounting heavily to maintain bookings and adding headcount faster than recurring revenue. Same headline growth. Very different businesses.
For founders, CEOs and finance leaders, the implication is important: SaaS financial planning should not start with a revenue growth percentage. It should start with the economic engine underneath that growth.
That means connecting six questions:
- How much ARR are we adding?
- How much ARR are we retaining?
- How much does it cost to acquire?
- How much gross profit does that ARR generate?
- How much cash must we invest to produce the growth?
- And what does that combination imply for enterprise value?
In 2026, these questions matter even more. SaaS Capital’s survey of more than 1,000 private B2B SaaS companies found median growth of approximately 22%, with bootstrapped companies growing around 20% and equity-backed companies around 25%. The environment still rewards growth—but increasingly distinguishes between growth and economically productive growth.
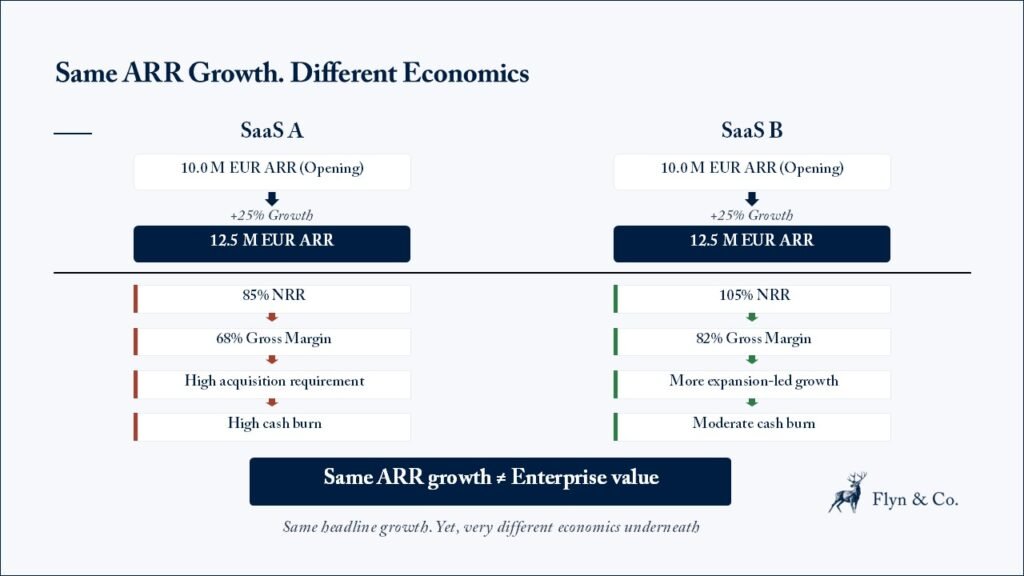
Two different SaaS Companies : Same ARR growth ≠ same enterprise value
1. Start with the ARR bridge—not the P&L
Traditional budgeting often begins with last year’s revenue and applies a growth assumption. For SaaS, that is usually the wrong starting point. Revenue is the accounting output of several underlying movements; management should first understand what happens to the recurring revenue base.
A simple ARR bridge is:
Beginning ARR
+ New-logo ARR
+ Expansion ARR
− Contraction ARR
− Churned ARR
= Ending ARR
Consider a SaaS company beginning the year with EUR 10m of ARR and targeting 25% growth, implying EUR 12.5m at year-end. SaaS A could add EUR 4m of new-logo ARR, EUR 1m expansion, lose EUR 0.5m to contraction and EUR 2m to churn; SaaS B could add EUR 2m new-logo ARR, EUR 1.5m expansion, lose EUR 0.3m to contraction and EUR 0.7m to churn. Both reach EUR 12.5m, but their NRR is 85% and 105% respectively.
The headline is identical; the underlying economics are not. The ARR bridge shows where growth is actually coming from, with consequences for sales capacity, CAC, cash requirements, predictability and value.
Turn your SaaS metrics into a decision-ready financial model
Connect ARR, retention, hiring, margins and cash into one integrated model — built to support planning, funding and strategic decisions.
2. NRR is not a customer-success metric. It is part of the growth engine
Net Revenue Retention measures what happens to recurring revenue from the existing customer base before adding new customers.
NRR = (Beginning ARR + Expansion − Contraction − Churn) ÷ Beginning ARR
If NRR is above 100%, the installed base expands even before new logos are added. If it is below 100%, sales must first replace lost revenue before the company can grow. SaaS Capital’s 2026 research found that moving from the 90–100% NRR range to 100–110% was associated with approximately five percentage points of additional growth.
A SaaS plan should separate gross retention, expansion and new-logo acquisition. These are economically different forms of growth: one euro of expansion ARR can require far less acquisition spending than one euro of new-logo ARR, while new acquisition remains necessary to enlarge the installed base.
A management plan that simply says “grow ARR by 30%” is incomplete. Finance should ask how much comes from retention, expansion and new acquisition—and what resources each component requires.
3. Growth is only valuable if the unit economics support it
Once the ARR bridge is understood, the next question is how much the business must spend to create that ARR. For many SaaS companies, Sales & Marketing is effectively an investment portfolio: cash is spent today to acquire a customer whose economic return arrives over future years.
The central question is not simply “How much are we spending on Sales & Marketing?” It is “What recurring gross profit are we buying with that spending?”
CAC is the fully loaded cost of acquiring new customers and should include relevant sales and marketing costs, not only paid-media spend.
CAC payback = CAC ÷ monthly gross profit from the acquired customer. Shorter payback allows capital to be reinvested faster, but a customer acquired efficiently and lost nine months later may have worse economics than a more expensive enterprise customer retained for years.
LTV / CAC can be useful but is easily made to look impressive. Cohort behaviour, retention and CAC payback are often more decision-useful than a theoretical lifetime value extending many years into the future.
4. Gross margin determines how much of ARR is economically available
ARR receives disproportionate attention because recurring revenue is highly visible. But EUR 1 of ARR is not EUR 1 of economic contribution: a SaaS company must pay to host, support and deliver its product.
Suppose two companies each generate EUR 10m of ARR. One operates at an 85% gross margin and generates approximately EUR 8.5m of gross profit before Sales & Marketing, R&D and G&A. The other operates at 65% and generates EUR 6.5m. The 20-percentage-point gap represents EUR 2m of annual gross-profit capacity.
This matters as SaaS models evolve. Inference, compute and third-party model costs may scale with usage in AI-enabled products, reducing gross margins unless pricing and architecture are designed accordingly. Conventional SaaS benchmarks should not be transferred mechanically to AI-native companies.
Finance should model revenue and cost-to-serve together. A usage-based AI feature that drives ARR while carrying significant variable compute expense may be commercially attractive but produce less gross profit than the subscription-revenue headline suggests.
5. The SaaS P&L should explain where the company is investing its gross profit
After gross profit, management is deciding where to reinvest economic capacity: Sales & Marketing to acquire and expand customers; R&D to improve the product and create future differentiation; Customer Success / Support to protect and expand the installed base; and G&A to provide operating infrastructure.
These should not be treated simply as cost percentages to reduce. Each is linked to a value driver. Cut Customer Success too deeply and NRR may deteriorate. Reduce R&D aggressively and margins improve immediately but product competitiveness may weaken later. Add sales capacity before pipeline and productivity justify it, and burn increases before ARR follows.
SaaS Capital’s 2026 survey shows the range of spending involved for private B2B SaaS companies with roughly USD 3m–5m of ARR: approximately 24% of ARR on R&D, 20% combined on selling and marketing, and 15% on G&A, alongside hosting, DevOps, customer success and other delivery costs. These are benchmarks, not targets. The useful question is: what output is the additional spending producing?
6. Connect hiring decisions directly to ARR creation
People are normally the largest expense base in SaaS, making headcount planning a critical part of the financial model. Budgets frequently contain a disconnect: the revenue plan assumes rapid growth, the hiring plan is built separately, and the cash forecast discovers the consequences afterwards.
- Account Executives → productive capacity → pipeline conversion → new ARR
- Customer Success Managers → account capacity → retention and expansion
- Engineers → product roadmap → delivery milestones and product scalability
The model must account for timing. A salesperson hired in January may require months of ramp before reaching full productivity; ARR may begin arriving afterwards, while cash compensation starts immediately.
Hiring → ramp → pipeline → bookings → ARR → revenue → gross profit → cash
If the financial model ignores the lag between these steps, it can materially underestimate funding requirements. This is why growth can create cash pressure even in an attractive SaaS model.
7. Manage burn as investment
A loss-making SaaS business is not automatically unhealthy, but losses need an economic explanation. Burning EUR 2m while adding EUR 5m of high-retention ARR with strong gross margins differs from burning EUR 2m to add EUR 1m of low-quality ARR.
Burn Multiple = Net Cash Burn ÷ Net New ARR
The burn multiple connects capital consumption with recurring-revenue creation, but it is only a starting point. Finance should pressure-test gross margin, NRR and GRR, customer concentration, CAC payback, contract duration, implementation costs, sales productivity and expected future expansion.
A low burn multiple built on weak retention can mislead. A higher burn multiple during a deliberate product expansion or enterprise GTM build may be rational if leading indicators support the investment. The point is not to minimise burn; it is to know what the burn is buying.
8. Rule of 40 is useful, but composition matters
A popular SaaS framework combines growth and profitability:
Revenue growth % + FCF margin %
A result above 40% is commonly referred to as satisfying the Rule of 40. For example, 30% growth + 10% FCF margin = 40%; so does 15% growth + 25% FCF margin. The arithmetic is convenient, but the economics are not necessarily equivalent.
Bessemer argues that, particularly for later-stage cloud businesses, investors should place greater weight on growth than a simple 1:1 Rule-of-40 calculation implies. Its Rule of X framework weights growth more heavily because recurring revenue can compound over future periods.
Do not manage the company to a single composite KPI. Understand the composition behind it: growth, retention, gross margin, sales efficiency and cash generation.
9. SaaS valuation starts with ARR
Private SaaS companies are frequently discussed in terms of ARR multiples, which can suggest that increasing ARR mechanically increases enterprise value. In reality, the multiple reflects the quality of the recurring-revenue engine. SaaS Capital’s updated 2026 private SaaS valuation framework uses factors including current ARR growth and NRR, alongside current public SaaS market multiples.
- SaaS A: 25% ARR growth, 85% NRR, 68% gross margin, heavy dependence on new-logo acquisition and high cash burn.
- SaaS B: 25% ARR growth, 105% NRR, 82% gross margin, greater expansion contribution and moderate cash burn.
An investor should not pay the same multiple simply because both companies report 25% ARR growth. SaaS B has greater revenue durability, stronger gross-profit conversion and potentially less capital required to sustain growth. Finance has two jobs: forecast performance, and improve the economic quality of the performance being forecast.
10. Build the SaaS plan around an integrated driver tree
A useful SaaS financial model should let management move from commercial assumptions to cash.
ARR
Beginning ARR + New customers × ACV + Expansion − Contraction − Churn
↓
Revenue: ARR converted into recognised subscription and usage revenue according to contract timing
↓
Gross profit: Revenue − Hosting − Infrastructure / compute − customer delivery costs − relevant support costs
↓
Operating investment: Sales & Marketing, R&D, Customer Success and G&A
↓
EBITDA / operating result
↓
Working capital, capex and other cash items
↓
Free cash flow and cash runway
The value of the model is not that it produces a forecast; it is that management can change an assumption and understand the chain reaction: NRR moving from 97% to 103%, CAC payback extending by four months, gross margin falling as AI usage grows, delayed Account Executive hires, rising ACV with a longer sales cycle, or growth falling from 30% to 20%.
A SaaS management dashboard: what should actually be on it?
A useful monthly dashboard does not need dozens of metrics. Track ARR / MRR, YoY ARR growth, GRR, NRR, new ARR, CAC payback, gross margin, ARR / employee, burn / FCF and cash runway. Deviations should trigger decisions with an operational explanation and an owner.
From SaaS metrics to capital allocation
ARR can be increased through discounting; NRR through price increases; CAC payback by cutting marketing; gross margin by reducing support; and FCF by slowing product investment. Each action may improve one KPI while weakening another. Finance should allocate capital across competing uses while understanding the consequences for growth, retention, margins and cash.
Conclusion
ARR is the starting point. Quality of ARR is the real story. The attraction of SaaS is straightforward: recurring revenue can compound. But compounding only works when the revenue stays, and durable value is created only when retaining and expanding that revenue generates sufficient gross profit relative to the capital required to acquire customers, build the product and operate the company.
ARR growth → retention → gross margin → acquisition efficiency → operating investment → free cash flow → enterprise value.
None should be managed in isolation. A SaaS company does not become financially stronger simply because ARR increases. It becomes stronger when each additional euro of ARR makes the recurring-revenue engine more valuable, and the path to the next euro of growth more economically attractive.
One final word : Stay tuned for more insights on Finance, Investing, Real Estate & Startups.
More posts...
Budget 2027: Build a Plan Your Business Can Actually Use
The strongest budgets make assumptions explicit, quantify the cash impact and define how management will respond.
Why Bordeaux Wine Estates Need a 24-Month Cash Model
Why Bordeaux Wine Estates Need a 24-Month Cash Model Bordeaux’s wine industry is adjusting to lower volumes, shifting consumption, weaker exports and structural vineyard contraction.
Fractional CFO vs. Full-time CFO: Which One Should an SME Choose?
Fractional CFO or full-time CFO? Learn which option makes more sense for SMEs, growing businesses, and founder-led companies that need financial leadership without overbuilding the finance function.
Bordeaux Neighborhoods for Property Investment: Which Signals Matter Most?
Learn how to assess Bordeaux neighborhoods for property investment using four key signals:
tenant demand, entry basis, capex risk, and exit depth. A practical framework for smarter real estate
decisions.
When Revenue Growth Becomes Dangerous: The Cash Flow Side of Scaling Too Fast
In small businesses, growth can consume cash faster than it creates it. The danger is not growth itself, but growth that stretches working capital, weakens margins, increases fixed costs, and hides liquidity risk behind a positive sales story.
The SME Reporting Pack: What Decision-Makers Should See Every Month
Most SME reporting packs are too backward-looking, too detailed, or too disconnected from decisions. A useful monthly reporting pack should show what happened, why it happened, what is likely to happen next, and what management needs to decide.